About the Project

A policy and performance dashboard for the Bureau of Reclamation to analyze the long-term impacts of water policies on the Colorado River system. The tool enables researchers and decision-makers to explore future hydrology scenarios, demand conditions, shortage tiers, and release strategies for Lakes Powell and Mead. With interactive features, users can create, compare, and modify policies, then overlay risk conditions (such as energy generation or water year releases) to understand vulnerabilities through the year 2055.
Project Name :
Bureau Of Reclamation
Category :
Hydrology & Environmental Sciences
Tools:
Figma
Photoshop
Illustrator
Service:
Application Design
Branding & Identity
Printable Media Design
Product Design
Product Development
Website Design

Challenges We Faced

  1. Complex Data Density: Hydrology data, shortage tiers, and future scenarios were highly technical and overwhelming if shown without structure.
  2. Layer Management: Users needed the ability to toggle multiple futures, risk conditions, and policies without losing context.
  3. Clarity for Mixed Audiences: The system had to be usable by technical hydrologists and policy stakeholders with limited data expertise.
  4. Consistency Across Models: With multiple policy paradigms and tiers, ensuring uniform inputs and outputs was critical for trust in the results.

Problems & Their Solutions

  1. Hydrology and shortage data were difficult to interpret in existing spreadsheets and reports.
Designed layered visualizations with clear summaries, so users could see shortages, deficits, and surpluses at a glance.
  2. Policy creation was confusing, with too many scattered options.
Built a step-by-step policy creation flow with tiered inputs, validation, and a review screen before submission.
  3. Future scenarios and risk conditions were hard to compare side by side.
Added a scenario manager where users could select multiple futures (e.g., Hot Drought, CMIP3 Baseline, Observed) and overlay them on performance results.
  4. Non-technical stakeholders struggled with technical indicators.
Introduced plain-language tooltips, icons, and summaries to make metrics like “Lee Ferry Deficit” or “Shortage Frequency” understandable.

Outcome & Results

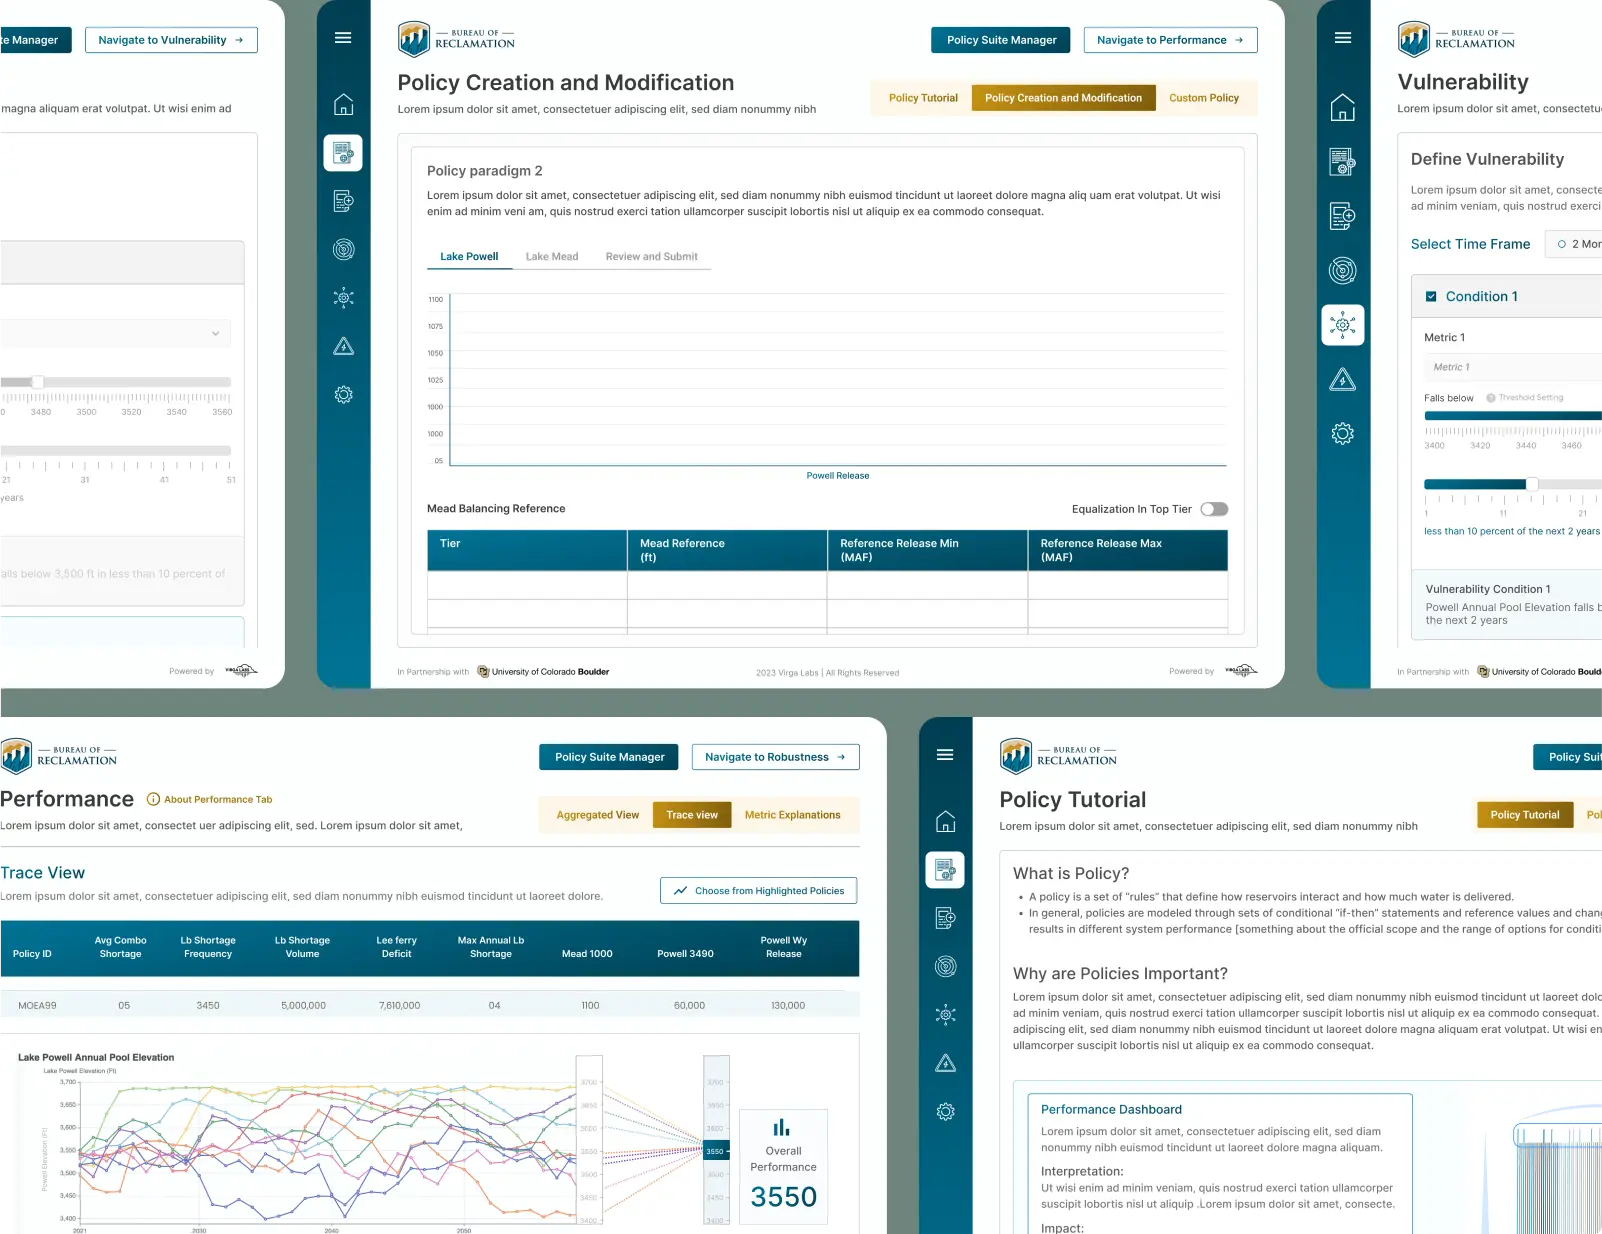
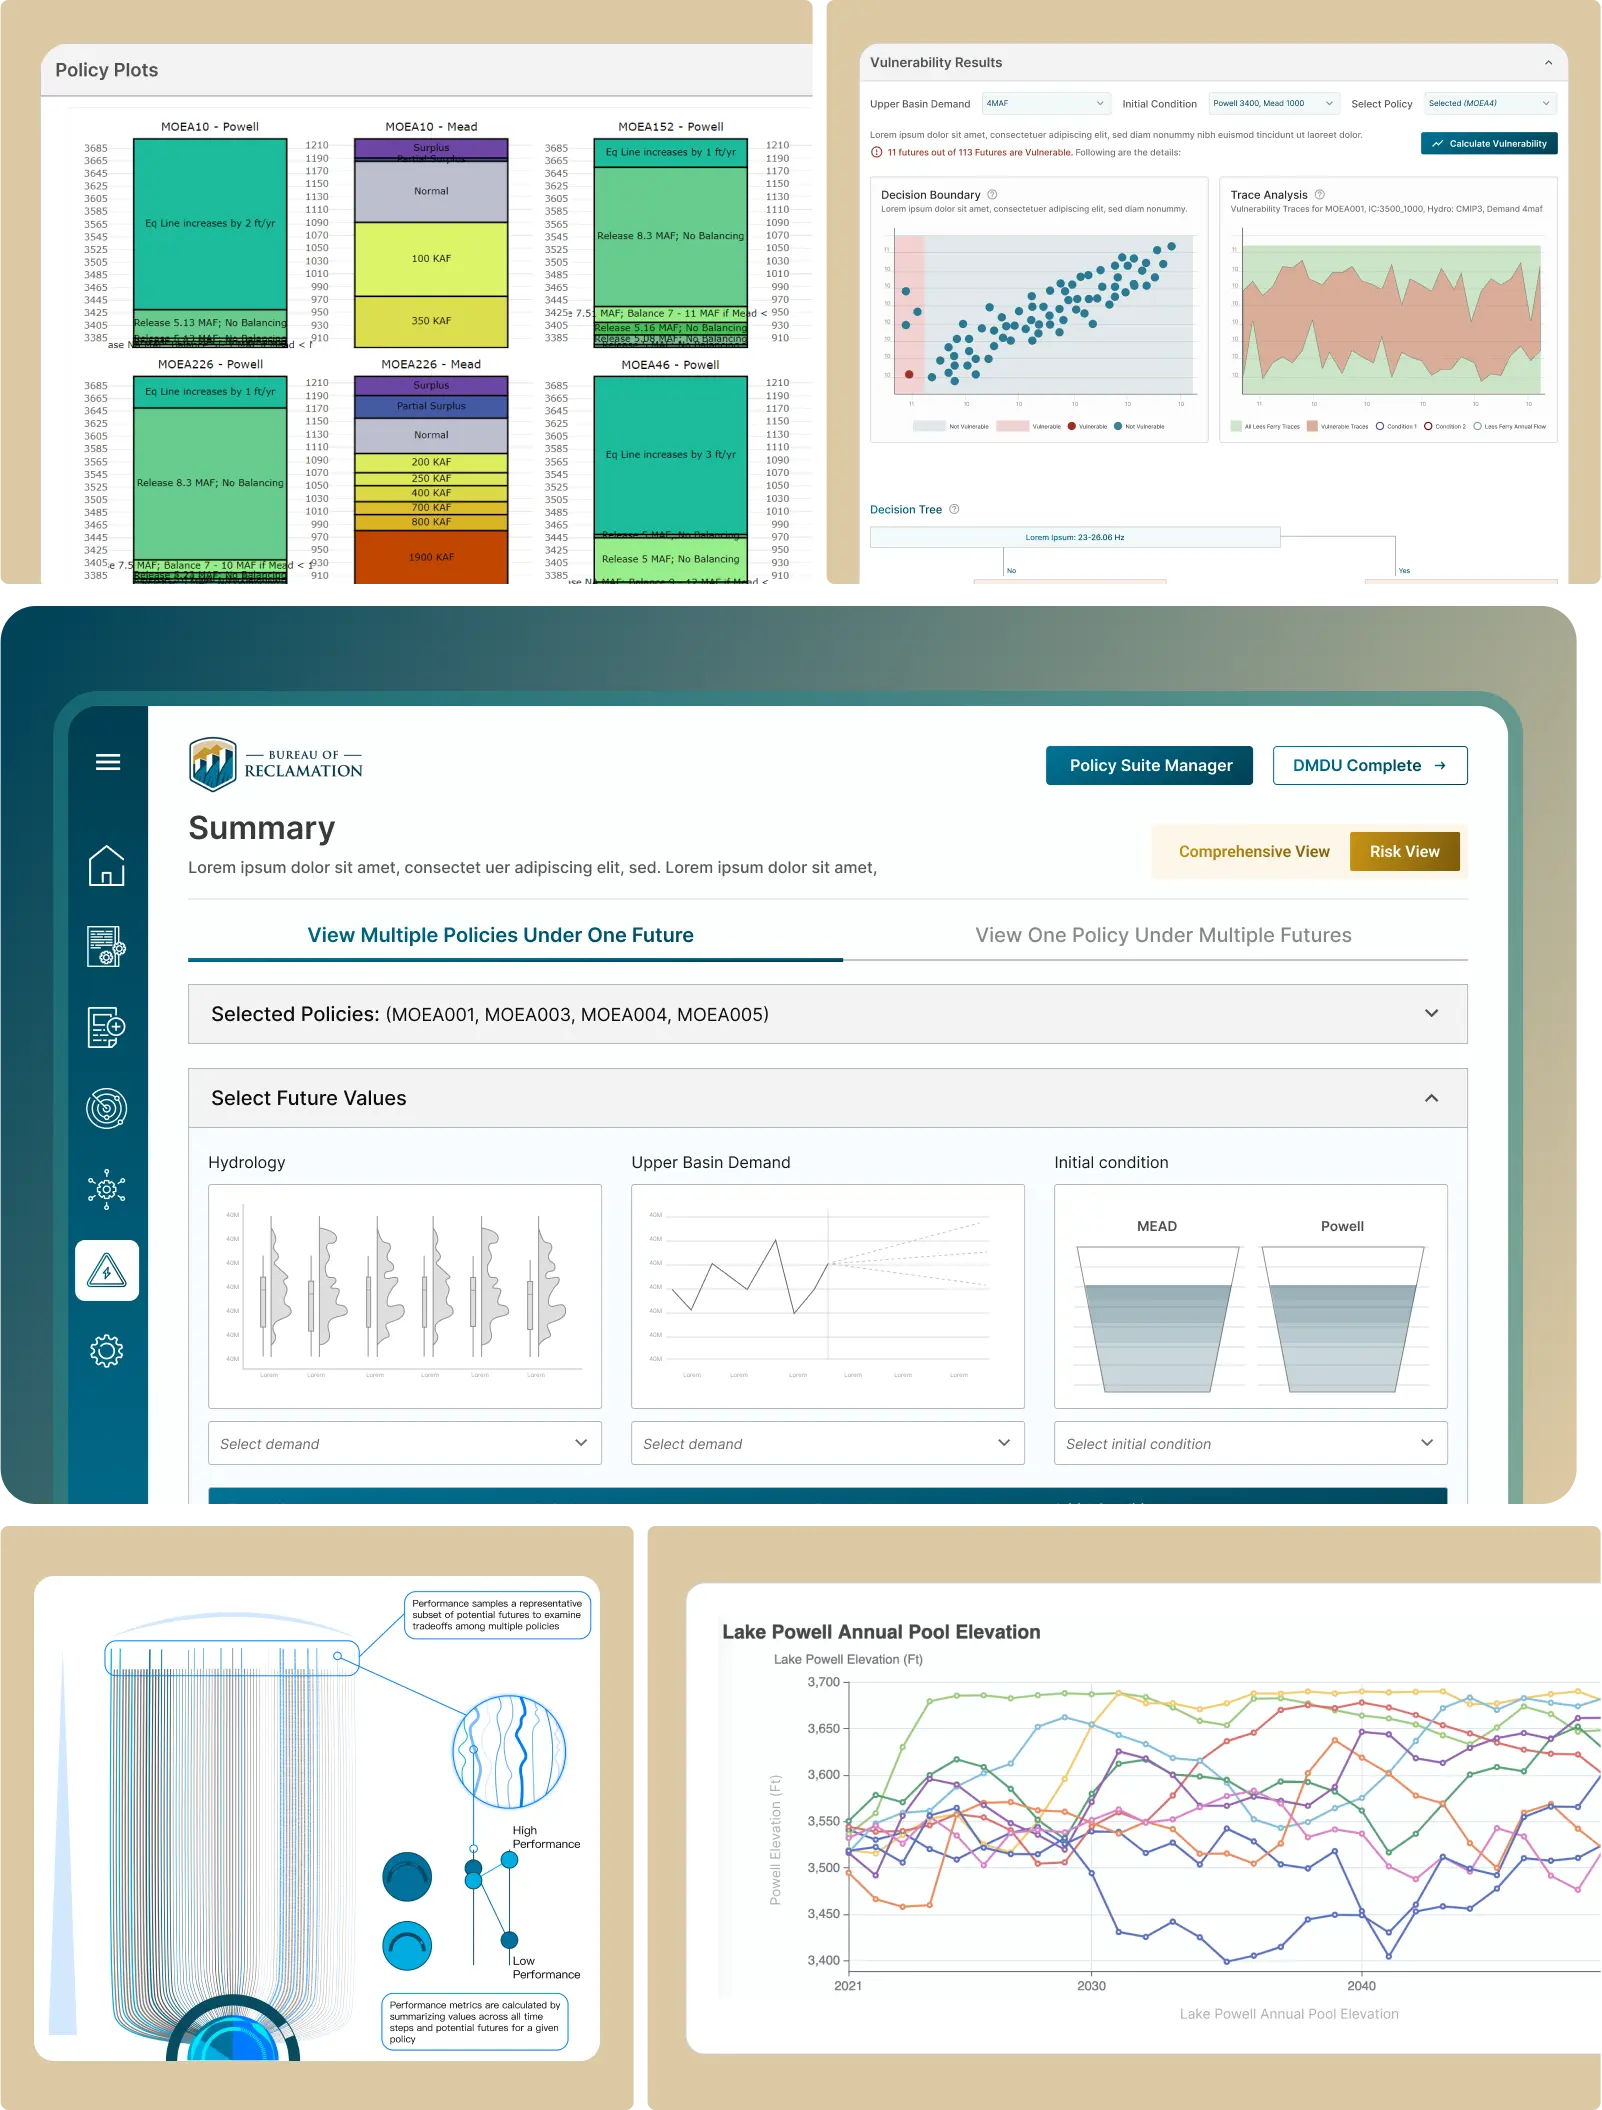
The final system provided the Bureau with a future-ready water policy simulator, capable of testing dozens of hydrology futures and shortage frameworks in minutes. Researchers gained efficiency through structured workflows, while policy stakeholders benefited from intuitive visualizations and guided policy creation. The platform reduced interpretation errors, improved communication across teams, and gave decision-makers confidence in planning for 2055 and beyond.

"This dashboard has completely transformed the way we evaluate water management policies. What used to take days of analysis is now interactive and visual, allowing us to test multiple futures, policies, and shortage scenarios in real time. The design strikes the right balance between technical depth for scientists and clarity for policymakers. It’s a tool we’ll rely on heavily as we plan for the Colorado River’s future."

Dr. Michael Reynolds
Policy Analyst, Bureau of Reclamation
IconIcon
Let’s Build Together
Got a Big Idea? Let’s Design the Smartest Route to Growth.
From first tap to lasting impact, we turn ambition into measurable results.